The Tech Edvocate

Top Menu

  • Advertisement
  • Apps
  • Home Page
  • Home Page Five (No Sidebar)
  • Home Page Four
  • Home Page Three
  • Home Page Two
  • Home Tech2
  • Icons [No Sidebar]
  • Left Sidbear Page
  • Lynch Educational Consulting
  • My Account
  • My Speaking Page
  • Newsletter Sign Up Confirmation
  • Newsletter Unsubscription
  • Our Brands
  • Page Example
  • Privacy Policy
  • Protected Content
  • Register
  • Request a Product Review
  • Shop
  • Shortcodes Examples
  • Signup
  • Start Here
    • Governance
    • Careers
    • Contact Us
  • Terms and Conditions
  • The Edvocate
  • The Tech Edvocate Product Guide
  • Topics
  • Write For Us
  • Advertise

Main Menu

  • Start Here
    • Our Brands
    • Governance
      • Lynch Educational Consulting, LLC.
      • Dr. Lynch’s Personal Website
      • Careers
    • Write For Us
    • The Tech Edvocate Product Guide
    • Contact Us
    • Books
    • Edupedia
    • Post a Job
    • The Edvocate Podcast
    • Terms and Conditions
    • Privacy Policy
  • Topics
    • Assistive Technology
    • Child Development Tech
    • Early Childhood & K-12 EdTech
    • EdTech Futures
    • EdTech News
    • EdTech Policy & Reform
    • EdTech Startups & Businesses
    • Higher Education EdTech
    • Online Learning & eLearning
    • Parent & Family Tech
    • Personalized Learning
    • Product Reviews
  • Advertise
  • Tech Edvocate Awards
  • The Edvocate
  • Pedagogue
  • School Ratings

logo

The Tech Edvocate

  • Start Here
    • Our Brands
    • Governance
      • Lynch Educational Consulting, LLC.
      • Dr. Lynch’s Personal Website
        • My Speaking Page
      • Careers
    • Write For Us
    • The Tech Edvocate Product Guide
    • Contact Us
    • Books
    • Edupedia
    • Post a Job
    • The Edvocate Podcast
    • Terms and Conditions
    • Privacy Policy
  • Topics
    • Assistive Technology
    • Child Development Tech
    • Early Childhood & K-12 EdTech
    • EdTech Futures
    • EdTech News
    • EdTech Policy & Reform
    • EdTech Startups & Businesses
    • Higher Education EdTech
    • Online Learning & eLearning
    • Parent & Family Tech
    • Personalized Learning
    • Product Reviews
  • Advertise
  • Tech Edvocate Awards
  • The Edvocate
  • Pedagogue
  • School Ratings
  • The Narwal Freo Z20 Is the Prime Day Gift That Actually Saves Time

  • Capsaicinens rolle: kultur, helse og dyrking av chilipepper

  • Study: Nearly all personal care and cleaning products contain undisclosed chemicals

  • This One AI Wearable Feature Is Quietly Erasing Public Privacy

  • Brutal: Over 200,000 Tech Layoffs in 2026 as AI’s Long Reset Unfolds

Data Analytics
Home›Data Analytics›What is Big Data Visualization?

What is Big Data Visualization?
By Matthew Lynch
May 5, 2023
0
Spread the love

Big Data Visualization: Making Sense of the Digital World

The digital revolution has brought with it an unprecedented amount of data being produced every day. This data comes from various sources such as social media, sensors, and transactions. While this data is valuable, it can be overwhelming to understand and analyze, especially when the dataset is large. This is where big data visualization comes in. This article will explore what big data visualization is, its importance, and some popular visualization techniques.

What is Big Data Visualization?

Big data visualization is the process of representing large and complex datasets in a visual form. This can be done through charts, graphs, maps, and dashboards, among others. The objective of big data visualization is to make the data more understandable, accessible, and actionable. By visualizing data, patterns, trends, and outliers can be identified, which can, in turn, lead to insights and informed decision making.

Importance of Big Data Visualization

The value of big data lies in its ability to solve problems, inform decision making, and drive innovation. However, big data is only valuable if it is analyzed and understood. This is where big data visualization becomes crucial. It provides a way to present data dynamically, making it easier to comprehend, interpret, and communicate. Furthermore, visualization enables stakeholders to gain insights that might not have been recognizable through traditional data analysis methods, such as spreadsheets and statistical analysis.

Popular Visualization Techniques

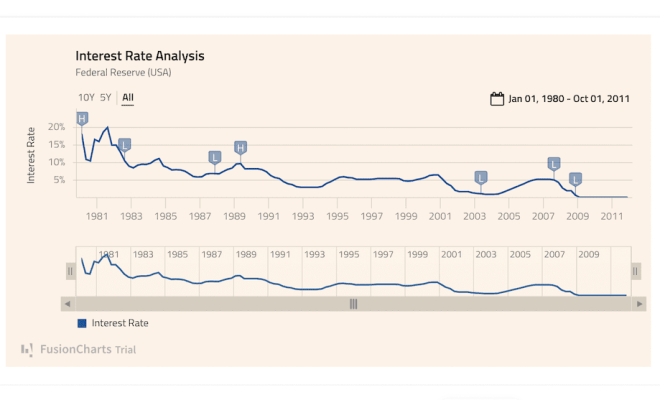
  1. Charts and graphs: These techniques display data using a variety of visual representations, such as bar charts, line charts, and pie charts. They are useful for displaying trends and patterns in data.
  2. Maps: Maps are useful for visualizing geospatial data, such as customer locations, store locations, and population distributions. They can be created using GIS software or custom tools.
  3. Heatmaps: A heatmap is a visual representation of data that displays values in a color scheme. It is useful for identifying hotspots of activity or clustering.
  4. Dashboards: Dashboards provide an overview of key performance indicators (KPIs) in real-time. They allow users to visualize trends, patterns, and anomalies quickly.

Conclusion

In conclusion, big data visualization is an essential tool for making sense of the vast amounts of data generated daily. It enables businesses, governments, and other organizations to gain insights into their operations, workflows, customers, and markets. By using big data visualization techniques, such as charts, graphs, and maps, stakeholders can understand their data better, leading to informed decision making and optimized performance.

Previous Article

What is Big Data Streaming?

Next Article

What is bimodal IT (bimodal information technology)?

Matthew Lynch

Related articles More from author

  • Data Analytics

    10 Best JavaScript Charting Libraries for Data Visualization in 2024

    March 26, 2024
    By Matthew Lynch
  • Data Analytics

    EU feeling pressure to tweak data, privacy legislation

    February 3, 2024
    By Matthew Lynch
  • Data Analytics

    What is Automatic Backup?

    May 5, 2023
    By Matthew Lynch
  • Data Analytics

    What is bimodal IT (bimodal information technology)?

    May 5, 2023
    By Matthew Lynch
  • Data Analytics

    Virtual Data Rooms

    October 10, 2024
    By Matthew Lynch
  • Data Analytics

    What is Big Data Management?

    May 5, 2023
    By Matthew Lynch

Search

Login & Registration

  • Log in
  • Entries feed
  • Comments feed
  • WordPress.org

Newsletter

Signup for The Tech Edvocate Newsletter and have the latest in EdTech news and opinion delivered to your email address!

About Us

Since technology is not going anywhere and does more good than harm, adapting is the best course of action. That is where The Tech Edvocate comes in. We plan to cover the PreK-12 and Higher Education EdTech sectors and provide our readers with the latest news and opinion on the subject. From time to time, I will invite other voices to weigh in on important issues in EdTech. We hope to provide a well-rounded, multi-faceted look at the past, present, the future of EdTech in the US and internationally.

We started this journey back in June 2016, and we plan to continue it for many more years to come. I hope that you will join us in this discussion of the past, present and future of EdTech and lend your own insight to the issues that are discussed.

Newsletter

Signup for The Tech Edvocate Newsletter and have the latest in EdTech news and opinion delivered to your email address!

Contact Us

The Tech Edvocate
910 Goddin Street
Richmond, VA 23231
(601) 630-5238
[email protected]

Copyright © 2026 Matthew Lynch. All rights reserved.