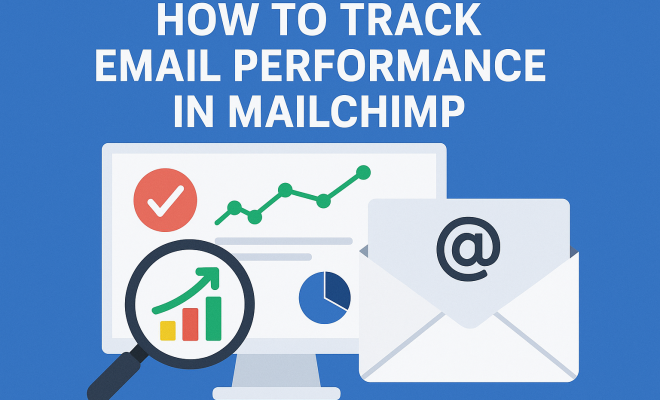
How to track email performance Mailchimp
“`html
So, you’re sending out emails through Mailchimp, which is great! But are those emails actually working? Are they bringing in new customers, engaging your audience, or driving sales? Simply hitting ‘send’ isn’t enough in today’s crowded digital landscape. To truly understand your marketing efforts and make smart decisions, you need to track email performance in Mailchimp. This isn’t just about vanity metrics; it’s about getting real, actionable insights into what resonates with your subscribers and what falls flat. Ignoring these metrics is like driving blindfolded – you might be moving, but you’re probably not going anywhere useful.
Many marketers, especially those new to email automation, often focus on just one or two obvious metrics, like open rates. While those are important, they only tell a fraction of the story. A holistic view requires digging deeper into a range of indicators that reveal the health of your list, the effectiveness of your content, and the overall return on your email marketing investment. Mailchimp, thankfully, provides a robust suite of reporting tools designed to help you do exactly that. We’re going to dive into the most crucial metrics you absolutely need to be monitoring, why they matter, and what they tell you about how to improve your next campaign.
1. Open Rate: Are They Even Seeing Your Email?
The open rate is often the first metric people look at, and for good reason. It’s the percentage of recipients who opened your email out of the total number of successfully delivered emails. A high open rate suggests your subject line and preheader text are compelling enough to grab attention in a busy inbox. Think of it as your email’s first impression. If people aren’t even opening your emails, then all the effort you put into the content, design, and call to action is essentially wasted. the power of video emails offers useful background here.
What influences your open rate? A lot, actually. Your subject line is paramount – it needs to be clear, concise, and create a sense of urgency or curiosity without being spammy. The sender name also plays a role; people are more likely to open emails from a recognizable and trusted source. The time of day you send your email and the day of the week can also significantly impact open rates, as can the overall health and engagement of your email list. If your list is full of inactive subscribers, your open rates will naturally suffer. Mailchimp’s reports let you easily see this metric for each campaign, and you can even compare it against industry averages within the platform.
2. Click-Through Rate (CTR): Are They Taking Action?
While open rate tells you if people are seeing your email, the click-through rate (CTR) tells you if they’re engaging with its content. This metric measures the percentage of recipients who clicked on at least one link within your email, out of the total number of successfully delivered emails. A strong CTR indicates that your email content is relevant, your call to action (CTA) is clear and compelling, and your overall message resonates with your audience. This is often a much better indicator of engagement than open rates alone, as it shows active interest.
To improve your CTR, focus on creating clear, prominent calls to action. Use strong action verbs and make sure your buttons or linked text stand out visually. Your email content should be persuasive and directly lead to the desired click. Personalization can also work wonders here; emails that feel tailored to the individual are more likely to drive clicks. A common mistake is including too many CTAs, which can dilute their effectiveness. Focus on one primary action you want the recipient to take, with perhaps one or two secondary options. Mailchimp provides detailed click maps, showing you exactly which links subscribers are clicking, which is invaluable for optimizing future campaigns.
3. Click-Through Open Rate (CTOR): How Engaged Are Your Openers?
This metric is a slightly more refined version of the CTR, offering deeper insight into the quality of your engagement. The Click-Through Open Rate (CTOR) measures the percentage of recipients who clicked a link, but only out of those who actually opened the email. Think of it this way: the CTR tells you how many people clicked out of everyone who *could* have clicked, while the CTOR tells you how many people clicked out of everyone who *did* open the email. It’s a powerful indicator of how effective your email content is at converting opens into actual engagement.
Why is CTOR important? Because a high open rate with a low CTR (and thus a low CTOR) suggests your subject line is great, but your email’s body content or call to action isn’t delivering on the promise of the subject line. Perhaps the content is irrelevant, poorly written, or the CTA is hard to find. Conversely, a lower open rate with a high CTOR means the people who *do* open your emails are highly engaged, and you might need to work on your subject lines or segmentation to reach more of your ideal audience. Mailchimp calculates this automatically for you, providing a clearer picture of content effectiveness.
4. Unsubscribe Rate: Are You Losing Your Audience?
The unsubscribe rate is one of those metrics nobody likes to look at, but it’s absolutely critical. It represents the percentage of recipients who opted out of your email list after receiving a specific campaign. While a certain level of unsubscribes is normal – people’s interests change, or they simply get too many emails – a consistently high unsubscribe rate is a flashing red light. It tells you that something is fundamentally wrong with your email strategy, your content, or your segmentation. (See: Email marketing overview on Wikipedia.)
A high unsubscribe rate can be triggered by several factors: sending too frequently, irrelevant content, emails that aren’t mobile-friendly, or even a sudden change in your brand’s messaging. It’s crucial to regularly review this metric. If you see a spike after a particular campaign, dig into that campaign’s content and audience. Did you send it to a segment that wasn’t interested? Was the tone off? Mailchimp offers clear reports on unsubscribes, and you can even see who unsubscribed, though not necessarily why (unless you offer a preference center with options). Monitoring this helps you refine your approach and maintain a healthy, engaged subscriber list, which is vital to track email performance in Mailchimp effectively.
5. Bounce Rate: Is Your List Healthy?
Your bounce rate is a direct measure of the deliverability of your emails, indicating the percentage of emails that couldn’t be delivered to the recipient’s inbox. There are two main types of bounces: hard bounces and soft bounces. Hard bounces are permanent delivery failures, often due to invalid email addresses, non-existent domains, or blocked recipients. Soft bounces are temporary issues, like a full inbox or a server being down, and Mailchimp will usually attempt to resend these.
A high bounce rate is a serious problem. Hard bounces, in particular, signal a decaying email list, which can harm your sender reputation and lead to more of your emails landing in spam folders. Mailchimp automatically removes hard-bounced addresses from your list, which is a helpful feature, but it’s still your responsibility to keep your list clean. Regularly auditing your list for inactive subscribers and using double opt-in processes can help minimize bounces. A clean list ensures your emails actually reach their intended audience, making all other performance metrics more meaningful. This is a foundational element to track email performance in Mailchimp.
6. Conversion Rate: Are They Buying or Signing Up?
This is often the ultimate metric for businesses, as it directly ties your email marketing efforts to your bottom line. The conversion rate measures the percentage of recipients who completed a desired action after clicking through from your email – whether that’s making a purchase, filling out a form, downloading a resource, or signing up for a webinar. While Mailchimp doesn’t calculate this natively within its email reports without integration, you can easily track this by setting up UTM parameters in your email links and monitoring them in Google Analytics or your e-commerce platform.
A low conversion rate despite a high CTR suggests a disconnect between your email’s promise and the landing page experience, or perhaps an issue with your product/service offering itself. Is your landing page clear, easy to navigate, and optimized for conversions? Does it fulfill the expectation set by your email? Are there too many steps in the checkout process? Optimizing your landing pages, refining your offers, and ensuring a seamless user journey from email to conversion point are all critical steps. This metric truly shows the ROI of your email campaigns.
7. Revenue Per Email (RPE): What’s Your Return on Investment?
For e-commerce businesses or those directly selling products/services, Revenue Per Email (RPE) is an incredibly powerful metric. It tells you, on average, how much revenue each email you send generates. To calculate this, you simply divide the total revenue generated from an email campaign by the total number of recipients (or successfully delivered emails). This gives you a tangible dollar value for each email, allowing you to directly compare the profitability of different campaigns.
Mailchimp offers excellent e-commerce tracking features, especially when integrated with platforms like Shopify or WooCommerce. This allows you to track specific purchases and revenue directly attributable to your email campaigns right within Mailchimp’s reports. A low RPE might signal that your product recommendations aren’t hitting the mark, your pricing strategy needs adjustment, or your email offers aren’t compelling enough. Conversely, a high RPE means your email strategy is a cash-generating machine. This metric is a fundamental way to track email performance in Mailchimp and understand its direct financial impact.
8. List Growth Rate: Are You Expanding Your Reach?
While not tied to a specific campaign, your list growth rate is a crucial overarching metric for the long-term health and sustainability of your email marketing efforts. It measures how quickly your email list is expanding over a given period. You calculate it by taking the number of new subscribers minus the number of unsubscribes and bounces, divided by your total number of subscribers at the start of the period, then multiplied by 100.
A healthy list growth rate ensures you have a continuous stream of new prospects and customers to engage with. If your list is shrinking or stagnant, your marketing reach will diminish over time, regardless of how good your individual campaign metrics are. Focus on strategies like compelling lead magnets, clear sign-up forms on your website, social media promotion, and partnerships to keep your list growing. Mailchimp provides clear audience growth reports, showing you how your list size changes over time and the sources of new subscribers. This macro-level view is essential for understanding the overall trajectory of your email program.
Bringing It All Together: Beyond the Numbers
Understanding these individual metrics is a great start, but the real power comes from seeing how they interact and what story they tell together. A high open rate with a low CTR on a particular campaign, for example, signals a problem with your email content, not your subject line. A sudden spike in unsubscribes might correlate with a change in your sending frequency or a controversial piece of content. By regularly monitoring and analyzing these reports in Mailchimp, you can identify trends, spot problems early, and refine your strategy based on concrete data. (See: CDC guidelines on email marketing.)
Mailchimp’s reporting dashboard is designed to make this analysis straightforward. You can compare campaigns side-by-side, view historical data, and even segment your audience based on engagement. Don’t just glance at the numbers; ask yourself ‘why?’ behind each statistic. Why did this campaign perform better than the last? Why are some segments more engaged than others? The answers to these questions are the keys to unlocking truly effective email marketing and continuously improving how you track email performance in Mailchimp.
Practical Tips for Ongoing Optimization
Now that you know which metrics to track, what do you actually *do* with that information? Optimization is an ongoing process, not a one-time fix. Here are some actionable strategies:
- A/B Test Everything: Mailchimp makes it easy to test different subject lines, sender names, content blocks, CTAs, and even send times. Small changes can yield significant improvements. Don’t assume; test and learn.
- Segment Your Audience: Sending the same email to everyone is rarely effective. Use Mailchimp’s segmentation tools to send targeted content to specific groups based on their interests, purchase history, or engagement levels. Personalized content almost always performs better.
- Clean Your List Regularly: Remove inactive subscribers who haven’t opened or clicked in a long time. While it might feel counterintuitive to remove subscribers, a smaller, more engaged list will yield better metrics and improve your sender reputation. Mailchimp has tools to help identify these folks.
- Monitor Industry Benchmarks: While your own historical data is the most important comparison, keeping an eye on industry averages (which Mailchimp often provides directly in reports) can give you context and help you set realistic goals.
- Integrate with Other Tools: Connect Mailchimp with your CRM, e-commerce platform, or analytics tools (like Google Analytics) to get a more complete picture of the customer journey and attribute conversions accurately. This is crucial for understanding ROI.
The Future of Email Performance Tracking
The landscape of email marketing is always evolving, with privacy changes (like Apple’s Mail Privacy Protection) impacting how certain metrics, particularly open rates, are measured. This makes it even more crucial to focus on deeper engagement metrics like CTR, CTOR, and conversion rates, which are less affected by these changes. While open rates still provide some valuable context, they shouldn’t be your sole focus.
Ultimately, effectively using Mailchimp’s robust reporting features isn’t just about crunching numbers; it’s about understanding your audience. Each metric is a piece of feedback from your subscribers, telling you what they like, what they ignore, and what drives them to act. By paying close attention to these signals and continuously adapting your strategy, you can transform your email campaigns from mere messages into powerful engines for growth and engagement. Don’t just send emails; send smart emails that drive results, and let Mailchimp’s data guide your way.
Expert Perspectives on Mailchimp Data Analysis
When you’re trying to track email performance in Mailchimp, it helps to hear how seasoned professionals approach the data. Many email marketing experts emphasize that vanity metrics, while easy to boast about, often distract from real business goals. For instance, a high open rate means little if no one is clicking through to your product pages or signing up for your service. They advocate for a “full-funnel” approach, where you trace a subscriber’s journey from email open all the way to a purchase or lead conversion.
One common piece of advice is to establish baselines. Don’t just look at a single campaign’s numbers in isolation. Instead, compare it to your own historical averages, similar campaigns, or even industry benchmarks. This comparison helps you identify what’s truly an outlier, whether good or bad. For example, if your average CTR is 2.5% and a new campaign hits 4%, you know you’ve done something right with that specific content or offer. Conversely, a drop to 1% signals an area needing immediate attention. The “why” behind these fluctuations is where the real learning happens, requiring marketers to act like detectives, digging into subject lines, content, segment choices, and even external factors like recent news or competitor activity.
Another perspective highlights the importance of customer lifetime value (CLV). While Mailchimp provides immediate campaign performance, connecting that data to CLV over time can show the true long-term impact of your email efforts. Are your email campaigns not just driving initial sales, but fostering loyalty and repeat purchases? Integrating Mailchimp data with a CRM system or advanced analytics platform allows for this deeper, more strategic view. This helps shift the focus from short-term gains to building sustainable customer relationships, making your email marketing a long-term asset rather than just a promotional tool.
Common Pitfalls to Avoid When Tracking Performance
Even with Mailchimp’s user-friendly interface, it’s easy to fall into traps when analyzing your email performance. Being aware of these common mistakes can save you a lot of time and misdirection: (See: New York Times article on email marketing trends.)
- Focusing Only on Opens: As mentioned earlier, with privacy changes, open rates are becoming less reliable as a sole indicator of engagement. They’re still useful for judging subject line effectiveness but shouldn’t be the primary measure of success. Prioritize clicks and conversions.
- Ignoring Trends Over Time: A single campaign’s performance can be an anomaly. What matters more is the trend of your metrics over weeks, months, or even years. Are your open rates generally increasing or decreasing? Is your list growth consistent? These long-term views reveal the health of your overall email program.
- Not Segmenting Your Data: Looking at overall campaign averages can mask important insights. If you send to a diverse list, some segments might perform exceptionally well while others drag down the average. Mailchimp lets you segment reports by groups, tags, or even purchase behavior, which can uncover hidden successes and failures.
- Failing to Connect Email to Business Goals: Every email you send should serve a specific business objective, whether it’s driving sales, generating leads, increasing brand awareness, or building community. If you can’t tie a metric back to one of these goals, you might be tracking the wrong thing.
- Not A/B Testing Consistently: “Set it and forget it” is the enemy of optimization. Even small, incremental tests on subject lines, CTAs, or imagery can lead to significant improvements over time. Make A/B testing a routine part of your campaign planning.
- Ignoring Mobile Performance: A vast number of emails are opened on mobile devices. If your emails aren’t optimized for mobile (responsive design, clear calls to action, easy-to-read fonts), your engagement metrics will suffer, and people will abandon your content quickly.
Frequently Asked Questions About Tracking Email Performance in Mailchimp
Q1: What’s a “good” open rate in Mailchimp?
A “good” open rate varies significantly by industry. For example, government emails often see higher open rates (around 28%) compared to retail (around 17%). Mailchimp’s reports often provide industry benchmarks to give you context. However, the best benchmark is your own historical performance. Aim to consistently improve on your past averages.
Q2: Why did my open rate suddenly drop, even though my subject lines are usually good?
A sudden drop could be due to several factors. It might be a change in your sender reputation, leading to more emails landing in spam folders. It could also be list fatigue from sending too frequently, or recent privacy changes (like Apple’s Mail Privacy Protection) that impact how opens are tracked. Review your bounce rate, check your sending frequency, and consider if any major external events might have affected your audience’s behavior.
Q3: How can I improve my Click-Through Rate (CTR) in Mailchimp?
To boost CTR, focus on compelling content that provides value, clear and prominent calls to action (CTAs), strong action-oriented language, and personalization. Make sure your email’s promise aligns with the landing page it links to. A/B test different CTA placements, button colors, and text to see what resonates most with your audience.
Q4: Mailchimp removes hard bounces automatically. Do I need to do anything else for list hygiene?
While Mailchimp handles hard bounces, you should also regularly identify and segment inactive subscribers (those who haven’t opened or clicked in a long time). You can try re-engagement campaigns for these segments, but if they remain unresponsive, removing them from your main list will improve your overall engagement metrics and sender reputation. A smaller, more engaged list is always better than a large, unresponsive one.
Q5: How do I track conversions if Mailchimp doesn’t do it natively for my specific goal (e.g., PDF download)?
For goals not directly integrated (like e-commerce purchases with Shopify), you’ll need to use UTM parameters on your email links. These are small tags added to your URLs that tell analytics tools (like Google Analytics) where the traffic came from. Once set up, you can track specific conversions (like a PDF download or form submission) in Google Analytics and attribute them back to your Mailchimp campaigns.
Q6: What’s the biggest mistake marketers make when looking at Mailchimp reports?
The biggest mistake is looking at metrics in isolation or without context. Don’t just celebrate a high open rate; check if it led to clicks and conversions. Don’t panic over a few unsubscribes; look at your overall list growth rate. The true story of your email performance lies in the interconnectedness of all these metrics and how they trend over time, relative to your goals.
“`
Trending Now
Frequently Asked Questions
How do I track email performance in Mailchimp?
To track email performance in Mailchimp, utilize the reporting tools provided by the platform. Focus on key metrics such as open rates, click-through rates, and conversion rates. These insights help you understand audience engagement and the effectiveness of your campaigns, allowing you to make informed adjustments for future emails.
What metrics should I monitor in Mailchimp?
In Mailchimp, it's essential to monitor several metrics including open rates, click-through rates, bounce rates, and unsubscribe rates. These metrics give you a comprehensive view of your email campaign's performance, helping you identify areas for improvement and optimize engagement with your subscribers.
Why is open rate important in email marketing?
The open rate is crucial as it indicates the percentage of recipients who opened your email, reflecting the effectiveness of your subject line and preheader text. A high open rate suggests that your content is appealing enough to grab attention, which is vital for driving engagement and achieving your marketing goals.
What does a high click-through rate mean?
A high click-through rate (CTR) indicates that a significant portion of recipients not only opened your email but also engaged with its content by clicking on links. This metric is a strong indicator of how well your email resonates with your audience and can lead to conversions or sales.
How can I improve my email open rates?
To improve email open rates, focus on crafting compelling subject lines and preheader text that grab attention. Personalization, segmentation of your audience, and optimal timing for sending emails also play crucial roles in increasing the chances of your emails being opened.
Agree or disagree? Drop a comment and tell us what you think.