Master Excel Charts: 10 Essential Tips for Data Visualization
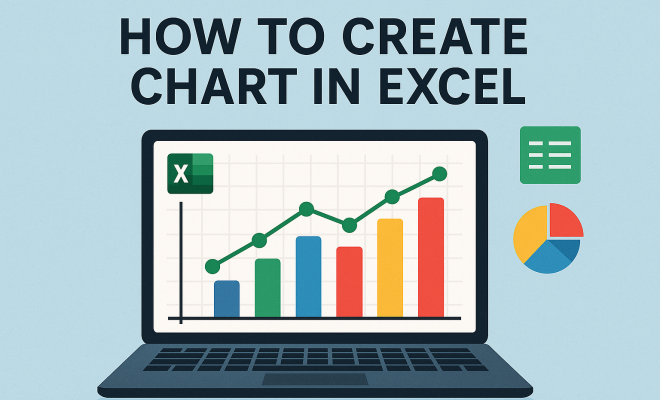
“`html
Whether you’re handling data for a project, creating financial forecasts, or presenting research findings, visual representation through charts can make an enormous difference. Learning how to create a chart in Excel is a vital skill that can enhance your data presentations and make your insights more digestible. In this article, we’ll explore ten essential tips to master Excel charts, helping you convey information effectively and efficiently.
1. Understanding the Basics of Excel Charts
Before diving into the specifics of how to create a chart in Excel, it’s crucial to grasp the different types of charts available. Excel offers a variety of chart types, including bar, line, pie, scatter, and area charts. Each serves a unique purpose: for instance, line charts are great for showing trends over time, while pie charts can be effective for illustrating parts of a whole.
When selecting a chart type, consider the nature of your data and the message you want to convey. For example, if you’re comparing sales figures across different regions, a bar chart would be more effective than a pie chart. Understanding these basics will guide you in choosing the right chart for your needs.
2. Preparing Your Data
The foundation of a successful chart lies in well-organized data. Ensure your data is structured correctly, with relevant variables in columns and appropriate labels in header rows. Having your data neatly organized will make the process of creating a chart smoother and more efficient.
Additionally, consider removing any unnecessary data or columns that may clutter the chart. For instance, if you’re working with a dataset that includes irrelevant statistics, eliminate those before starting the charting process. This not only streamlines your chart but also makes it easier to interpret.
3. Selecting the Right Chart Type
As mentioned previously, choosing the right chart type is crucial. Excel provides a Chart Wizard that helps you select the most suitable chart based on your data. Once your data is selected, navigate to the “Insert” tab and explore the Chart section to find the options available.
Common choices include:
- Column Charts: Best for comparing categorical data.
- Line Charts: Ideal for showing trends over time.
- Pie Charts: Effective for displaying proportions.
- Scatter Charts: Useful for showing relationships between two variables.
Take some time to experiment with different chart types. You may find that a chart you initially considered isn’t as effective as another option.
4. Creating Your First Chart
To actually create a chart in Excel, start by selecting the data range you want to visualize. Once your data is highlighted, navigate to the “Insert” tab on the ribbon. From there, choose your desired chart type. Excel will generate a default chart that you can customize.
After creating your chart, you can resize it and move it around your worksheet. This flexibility allows you to position it in a way that complements your report or presentation. Remember, the visual appeal of your chart can significantly impact its effectiveness.
5. Customizing Your Chart
Excel charts come with a variety of customization options that can enhance their visual appeal and make them more informative. You can modify chart elements such as titles, labels, colors, and legends to match your preferences or branding.
To customize a chart, click on the chart to reveal the Chart Tools on the ribbon. Under the “Design” tab, you’ll find options to change the chart type or the overall design. The “Format” tab allows for detailed adjustments, such as font styles and colors. Don’t hesitate to play around with these settings to find the look that best represents your data. (See: Understanding different types of charts.)
6. Adding Data Labels
Data labels can provide additional context to your chart, making it easier for viewers to understand the information being presented. Adding data labels to your chart can clarify figures and percentages without requiring viewers to interpret the axes directly.
To add data labels, simply click on the chart, then navigate to the “Chart Elements” button (the plus sign on the upper right corner). Check the box for “Data Labels” and choose a placement option that works well with your chart type. This small addition can significantly improve the clarity of your chart.
7. Using Chart Styles and Themes
Excel offers numerous chart styles and themes that can instantly enhance your chart’s appearance. By applying a theme, you can maintain consistency across various charts in your workbook, making your data presentations look more professional.
To access chart styles, click on the chart, then go to the “Design” tab. Here, you can browse different styles and color schemes. Applying a cohesive style can help your audience focus on the data rather than the distracting elements of an unpolished chart.
8. Creating Dynamic Charts with Filters
For more advanced users, creating dynamic charts can take your presentations to the next level. You can use Excel’s filtering tools to create charts that update automatically based on selected criteria. This is particularly useful in dashboards or interactive reports.
To create a dynamic chart, start by setting up a data range with filters. Then, create your chart based on this range. As you adjust the filters, your chart will change accordingly. This interactivity can engage your audience and provide them with a more personalized experience.
9. Exporting and Sharing Your Charts
Once your chart is complete, you might want to share it with others or use it in a presentation. Excel allows you to export charts in various formats, making it easy to include them in reports or slideshows. You can copy the chart directly into other applications, such as PowerPoint or Word.
Alternatively, you can save your chart as an image by right-clicking on it and selecting “Save as Picture.” This feature is useful if you want to share the chart via email or embed it into a web page. Just ensure that the quality of the image is maintained for clarity.
10. Staying Updated with Excel Features
Microsoft Excel regularly updates its features, including charting functionalities. Staying informed about these updates can help you utilize the software to its fullest potential. Regularly check Microsoft’s official website or community forums to learn about new features or enhancements that can improve your charting experience.
Moreover, consider exploring online resources, courses, or tutorials that can provide deeper insights into advanced charting techniques. Whether you’re a beginner or an experienced user, there’s always something new to learn that can enhance your ability to create a chart in Excel effectively.
Being adept at creating and customizing charts in Excel is not just a technical skill; it can significantly enhance your ability to communicate data-driven insights. By following the tips outlined in this article, you can become proficient in creating charts that not only look good but also illustrate your points clearly and effectively.
11. Exploring Advanced Chart Types
While the basic chart types cater to most needs, Excel also offers advanced chart types that can provide deeper insights into your data. Understanding and utilizing these can help you present your information with a higher level of sophistication. Examples of advanced chart types include:
- Combination Charts: These allow you to combine two different chart types to highlight various aspects of the data. For instance, you can use a column chart for sales figures while overlaying a line chart for sales growth percentage.
- Waterfall Charts: Particularly useful for financial data, waterfall charts visually represent the cumulative effect of sequentially introduced positive or negative values. This is excellent for showcasing how an initial value is affected by a series of increases and decreases.
- Radar Charts: Also known as spider charts, these are great for comparing multiple quantitative variables. They allow you to see how different subjects measure up on various axes.
- Heat Maps: These give a visual representation of data in two dimensions, using colors to indicate different values. Heat maps are useful for presenting complex data sets, such as performance metrics across several departments.
Experimenting with these advanced chart types can enhance the visual storytelling of your data and engage your audience more effectively.
12. Effective Use of Colors in Charts
Colors play a significant role in how information is perceived. When creating charts in Excel, consider the following tips for using colors effectively: (See: Data visualization in research.)
- Be Consistent: Use a consistent color scheme throughout your charts to create a cohesive look. This helps viewers quickly associate colors with certain data points.
- Limit the Palette: Too many colors can be distracting. Stick to a limited color palette to enhance readability and focus attention on critical data.
- Use Contrast Wisely: Ensure there’s enough contrast between colors, especially when they are adjacent to one another. This makes it easier for viewers to distinguish between different data series.
- Be Mindful of Color Blindness: Consider using colors that are distinguishable by those with color blindness, such as blue and orange, rather than red and green.
By paying attention to color usage, you can create more effective and accessible charts that communicate your message clearly to all audiences.
13. Incorporating Annotations and Callouts
Sometimes, a chart needs extra information to clarify complex points or highlight specific data trends. This is where annotations and callouts come in handy. They allow you to add context to your data without cluttering it.
To add annotations, you can use text boxes or shapes directly on your chart. For example, if there’s a significant peak in sales during a holiday season, adding a callout with a note explaining this can provide the audience with better insight. Think of it as a way to narrate the story your data is telling.
14. Best Practices for Chart Design
To ensure your charts are effective, here are some best practices to follow:
- Keep It Simple: Avoid overcrowding your charts with too much information. A simple design can convey messages more effectively.
- Be Clear and Precise: Use clear labels and a concise title that summarizes what the chart represents. Viewers should grasp the main idea at a glance.
- Use Appropriate Scales: Ensure that the scales on your axes are appropriate to avoid misleading your audience. For example, starting a vertical axis at a number other than zero can exaggerate differences.
- Test with an Audience: If possible, show your charts to someone else before presenting. They might catch things you overlooked or suggest helpful changes.
By adhering to these best practices, you can improve the effectiveness of your charts and ensure they resonate with your audience.
15. FAQs about Creating Charts in Excel
Q1: Can I create charts from pivot tables?
A1: Yes! In Excel, you can create charts directly from pivot tables. Just click on the pivot table and navigate to the “Insert” tab to choose your chart type.
Q2: How do I change the data range for my existing chart?
A2: Click on the chart, then right-click and select “Select Data.” Here, you can adjust the data range as needed.
Q3: My chart looks too cluttered. How can I simplify it?
A3: Consider removing unnecessary elements like gridlines, data labels, or legends if they’re not needed. You can also explore using a different chart type that better represents your data.
Q4: Is it possible to animate charts in Excel?
A4: While Excel does not have built-in animation features like PowerPoint, you can create the effect of animation by building charts step-by-step or by using VBA (Visual Basic for Applications) macros.
Q5: Can I customize the axis scale in Excel charts?
A5: Absolutely! You can right-click on the axis and select “Format Axis” to set custom minimum and maximum values, change the interval, and adjust other settings.
16. Statistics and Data Visualization Trends
In today’s data-driven world, the importance of effective visualization cannot be overstated. According to a report by the Data Visualization Society, over 70% of professionals believe that their productivity and decision-making processes improved with the use of charts and data visualization techniques. In fact, reports suggest that visuals can increase retention rates by up to 65% compared to text alone. (See: Harvard University resources on data presentation.)
Moreover, research from the Nielsen Norman Group reveals that people process visuals 60,000 times faster than text. This statistic underscores the need to master how to create a chart in Excel, especially as data becomes more complex and abundant.
As organizations increasingly rely on data for strategic decisions, the demand for professionals skilled in data visualization is on the rise. According to LinkedIn’s 2023 report, data visualization skills are among the top ten most important skills in the job market today, reflecting its significance across various industries.
17. Considerations for Accessibility
When creating charts, it’s crucial to consider accessibility. Not all viewers may have the same abilities to interpret visual data, so you should aim for inclusivity. Here are some tips to ensure your charts are accessible to all:
- Use Alternative Text: Adding alternative text descriptions can help visually impaired users understand what the chart represents. Excel allows you to add alternative text to your charts for screen readers.
- Choose Color Blind Friendly Palettes: Tools such as ColorBrewer can assist in selecting color schemes that are friendly to those with color vision deficiencies.
- Provide Context: In addition to visual charts, offer textual explanations or summaries that elaborate on the data being presented. This can benefit those who may struggle to interpret the visual data alone.
- Test with Diverse Audiences: Before finalizing your charts, consider testing them with a diverse audience to gauge their effectiveness and accessibility.
18. Using Excel Add-Ins for Enhanced Chart Creation
Excel’s functionality can be significantly expanded using various add-ins designed to simplify and enhance the chart creation process. For instance, the Power Query add-in allows users to import and manipulate data more efficiently before creating charts, making it easier to handle large datasets.
Additionally, consider exploring add-ins like Think-Cell or ChartExpo, which offer advanced chart types that might not be available in standard Excel. These tools can help you create more visually appealing and informative charts quickly, saving time and enhancing the overall quality of your presentations.
19. Real-World Examples of Effective Chart Use
Nothing communicates data like a well-crafted chart. Let’s examine a few real-world examples where effective charting has significantly impacted data presentation:
- Sales Performance Dashboard: A company used combination charts to display monthly sales figures against their yearly targets, helping management visualize gaps and trends over several years.
- Market Research: A marketing team employed pie charts to represent customer demographics, allowing stakeholders to quickly grasp the proportions of target audiences without wading through lengthy reports.
- Financial Reporting: An investment firm utilized waterfall charts to show how various factors contributed to profit/loss in quarterly reports, enabling investors to understand performance drivers at a glance.
These examples illustrate how mastering the art of chart creation can empower professionals to convey complex data insights succinctly and effectively.
20. Final Remarks on Chart Creation
Creating impactful charts in Excel is more than just a technical task; it’s about telling a story with data. The skills you acquire in mastering Excel charts can enhance your ability to communicate effectively, making your insights stand out in a crowded information landscape. Whether you’re preparing for a business meeting, writing a research paper, or presenting to clients, the ability to create a chart in Excel will undoubtedly add value to your work.
Keep experimenting with different techniques, stay informed about the latest trends, and don’t shy away from seeking feedback. The more you practice and refine your skills, the better your charts—and, by extension, your communication—will become.
“`
Trending Now
Frequently Asked Questions
How do I create a chart in Excel?
To create a chart in Excel, first organize your data in columns with clear headers. Highlight the data you want to include, then navigate to the 'Insert' tab and choose the desired chart type from the Chart options. Excel will generate a chart based on your selected data, which you can further customize.
What types of charts can I create in Excel?
Excel offers various chart types including bar, line, pie, scatter, and area charts. Each type serves different purposes; for example, line charts are ideal for showing trends over time, while pie charts effectively illustrate parts of a whole. Choosing the right chart type depends on your data and the message you wish to convey.
How do I prepare data for charting in Excel?
Preparing your data for charting in Excel involves organizing it in a structured format, with relevant variables in columns and clear headers. Eliminate unnecessary data that may clutter your chart. Neatly organized data ensures a smoother chart creation process and makes the final chart easier to interpret.
What is the Chart Wizard in Excel?
The Chart Wizard in Excel is a tool that guides users through the process of creating charts. It helps you select the appropriate chart type based on your data and preferences, making it easier to visualize information correctly. The wizard simplifies the creation process, especially for beginners.
How do I customize charts in Excel?
To customize charts in Excel, click on the chart to access the Chart Tools, which include Design and Format tabs. From there, you can change chart styles, colors, and layouts, add chart elements like titles and legends, and adjust the data range. Customization enhances the visual appeal and clarity of your chart.
Have you experienced this yourself? We’d love to hear your story in the comments.