The Tech Edvocate

Top Menu

  • Advertisement
  • Apps
  • Home Page
  • Home Page Five (No Sidebar)
  • Home Page Four
  • Home Page Three
  • Home Page Two
  • Home Tech2
  • Icons [No Sidebar]
  • Left Sidbear Page
  • Lynch Educational Consulting
  • My Account
  • My Speaking Page
  • Newsletter Sign Up Confirmation
  • Newsletter Unsubscription
  • Our Brands
  • Page Example
  • Privacy Policy
  • Protected Content
  • Register
  • Request a Product Review
  • Shop
  • Shortcodes Examples
  • Signup
  • Start Here
    • Governance
    • Careers
    • Contact Us
  • Terms and Conditions
  • The Edvocate
  • The Tech Edvocate Product Guide
  • Topics
  • Write For Us
  • Advertise

Main Menu

  • Start Here
    • Our Brands
    • Governance
      • Lynch Educational Consulting, LLC.
      • Dr. Lynch’s Personal Website
      • Careers
    • Write For Us
    • The Tech Edvocate Product Guide
    • Contact Us
    • Books
    • Edupedia
    • Post a Job
    • The Edvocate Podcast
    • Terms and Conditions
    • Privacy Policy
  • Topics
    • Assistive Technology
    • Child Development Tech
    • Early Childhood & K-12 EdTech
    • EdTech Futures
    • EdTech News
    • EdTech Policy & Reform
    • EdTech Startups & Businesses
    • Higher Education EdTech
    • Online Learning & eLearning
    • Parent & Family Tech
    • Personalized Learning
    • Product Reviews
  • Advertise
  • Tech Edvocate Awards
  • The Edvocate
  • Pedagogue
  • School Ratings

logo

The Tech Edvocate

  • Start Here
    • Our Brands
    • Governance
      • Lynch Educational Consulting, LLC.
      • Dr. Lynch’s Personal Website
        • My Speaking Page
      • Careers
    • Write For Us
    • The Tech Edvocate Product Guide
    • Contact Us
    • Books
    • Edupedia
    • Post a Job
    • The Edvocate Podcast
    • Terms and Conditions
    • Privacy Policy
  • Topics
    • Assistive Technology
    • Child Development Tech
    • Early Childhood & K-12 EdTech
    • EdTech Futures
    • EdTech News
    • EdTech Policy & Reform
    • EdTech Startups & Businesses
    • Higher Education EdTech
    • Online Learning & eLearning
    • Parent & Family Tech
    • Personalized Learning
    • Product Reviews
  • Advertise
  • Tech Edvocate Awards
  • The Edvocate
  • Pedagogue
  • School Ratings
  • A Visitors Guide to Jacksonville (FL), United States

  • The Classic Style of Brooks Brothers Shirts

  • Why Tech and Gaming Enthusiasts Should Jump on Nex Playground’s October Prime Day Deals

  • The Science Behind CrossFit Training

  • A Visitors Guide to Nova Iguaçu, Brazil

  • Product Review: Levoit LVAC-300 – The Self-Emptying Cordless Wonder

  • Philips Norelco OneBlade Hybrid Electric Trimmer

  • Remington PG6025 All-in-1 Lithium Powered Grooming Kit

  • Remington HC4250 Shortcut Pro

  • Wahl Professional 5-Star Magic Clip

Data Analytics
Home›Data Analytics›10 Best JavaScript Charting Libraries for Data Visualization in 2024

10 Best JavaScript Charting Libraries for Data Visualization in 2024

By Matthew Lynch
March 26, 2024
0
Spread the love

The role of data visualization in the modern web is immense, as it allows for a clear and concise presentation of complex data. It provides better insights and helps in making informed decisions. JavaScript, being at the forefront of client-side scripting, has various libraries that stand out for their charting capabilities. Here are the 10 best JavaScript charting libraries for data visualization in 2024:

1. Chart.js: Known for its simplicity, Chart.js offers beautiful charts with just a few lines of code. It supports eight chart types, including the traditional bar, line, and pie charts, as well as more complex types like radar and polar area charts.

2. D3.js: The powerhouse of data visualization libraries, D3.js allows you to produce dynamic, interactive data visualizations in web browsers using SVG, HTML5, and CSS standards. D3’s functional style lets you manipulate documents based on data.

3. Highcharts: A multi-platform library that’s easy to implement and doesn’t rely heavily on client-side resources. Highcharts offers a wide variety of chart types and integrates well with both mobile and web applications.

4. Plotly.js: With an array of options for complex statistical charts, Plotly.js also provides a simple interface for creating multi-functional dashboards that can be translated into various languages.

5. amCharts 5: Known for extremely fast rendering times, amCharts 5 is another top contender that supports all common charts types and works seamlessly across all modern browsers and mobile devices.

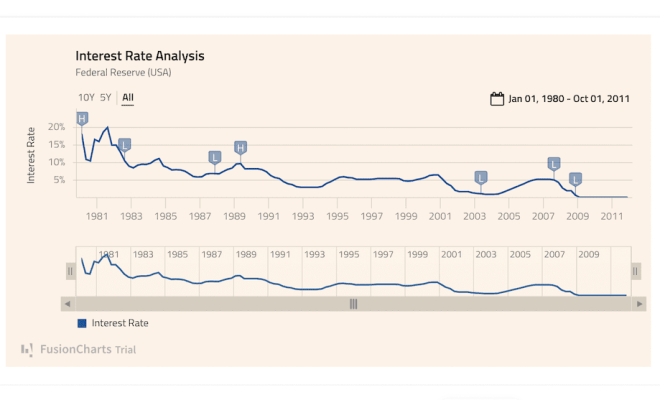
6. FusionCharts: Offering over 90 chart types and loads of features like interactive tooltips and drill-downs, FusionCharts specializes in maps and can render in both SVG and Canvas, which makes it highly flexible.

7. ApexCharts.js: ApexCharts brings you a modern design in charting libraries with high-performance rendering for your large datasets; not to mention its wide array of graphs including heatmaps and radial bar charts.

8. ZingChart: A feature-rich library that promises everything from simple line graphs to complex hierarchical tree maps; ZingChart also emphasizes interactive features to enhance the user experience.

9. Toast UI Chart: This library stands out for its ease of integration with other Toast UI tools. The Toast UI Chart provides all standard charts along with unique features like map chart support without any external dependencies.

10. ECharts: Developed by Baidu, ECharts provides an impressive suite of interactive charting and visualization options with strong emphasis on animated data visualizations.

Each of these libraries serves different needs depending on factors such as project requirements, performance considerations, and ease of use. When selecting a JavaScript charting library for your project, consider the type of visualization you need, browser compatibility issues, responsiveness on various devices as well as how fitting it is within your existing development stack.

Previous Article

The 13 Best Museums in Houston, Texas

Next Article

Discovering the Best Draught Excluder for Your ...

Matthew Lynch

Related articles More from author

  • Data Analytics

    Which Certification Is Best for Big Data?

    March 12, 2024
    By Matthew Lynch
  • Data Analytics

    What is Big Data Visualization?

    May 5, 2023
    By Matthew Lynch
  • Data Analytics

    What is Big Data Analytics?

    May 5, 2023
    By Matthew Lynch
  • Data Analytics

    What is Big Data Streaming?

    May 5, 2023
    By Matthew Lynch
  • Data Analytics

    What is Big Data Platform?

    May 5, 2023
    By Matthew Lynch
  • Data Analytics

    Regain Control of Your Data in 2024. Here’s Everything You Need to Know About Deleting Your Information

    February 1, 2024
    By Matthew Lynch

Search

Login & Registration

  • Register
  • Log in
  • Entries feed
  • Comments feed
  • WordPress.org

Newsletter

Signup for The Tech Edvocate Newsletter and have the latest in EdTech news and opinion delivered to your email address!

About Us

Since technology is not going anywhere and does more good than harm, adapting is the best course of action. That is where The Tech Edvocate comes in. We plan to cover the PreK-12 and Higher Education EdTech sectors and provide our readers with the latest news and opinion on the subject. From time to time, I will invite other voices to weigh in on important issues in EdTech. We hope to provide a well-rounded, multi-faceted look at the past, present, the future of EdTech in the US and internationally.

We started this journey back in June 2016, and we plan to continue it for many more years to come. I hope that you will join us in this discussion of the past, present and future of EdTech and lend your own insight to the issues that are discussed.

Newsletter

Signup for The Tech Edvocate Newsletter and have the latest in EdTech news and opinion delivered to your email address!

Contact Us

The Tech Edvocate
910 Goddin Street
Richmond, VA 23231
(601) 630-5238
[email protected]

Copyright © 2025 Matthew Lynch. All rights reserved.