The Duck Curve: What Is It and Is It a Problem?

The Duck Curve is a term that has been associated with the electric grid for some time now. It is a phenomenon that has emerged as a consequence of the growing deployment of renewable energy sources like solar and wind power. In this article, we will explore what exactly the Duck Curve is, its implications, and whether or not it poses a problem for the energy industry.
What Is The Duck Curve?
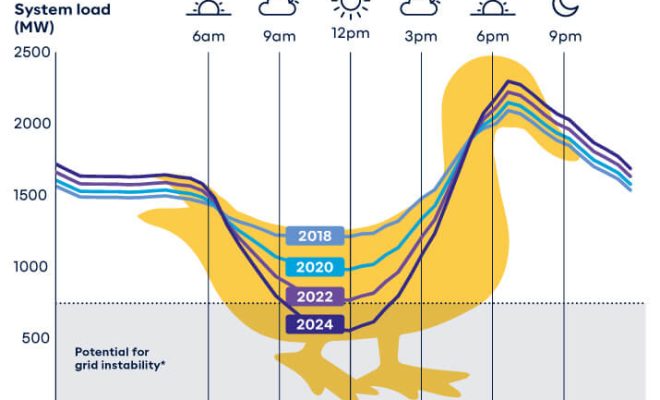
The Duck Curve is a graphical representation of the net load on the electrical grid throughout the day. Essentially, it demonstrates the difference between electricity demand and renewable energy supply. The shape of this curve resembles that of a duck—hence its name—with a pronounced dip in the middle of the day when solar power generation is at its peak.
The Duck Curve arises because solar power generation peaks during midday when the sun is shining brightly, but electricity demand usually peaks in the early morning and evening hours when people are at home using appliances. During solar generation peaks, there is often an excess of electricity supply that can lead to lower wholesale prices. However, as solar generation declines towards late afternoon and evening, there is a rapid increase in demand causing grid operators to ramp up fossil fuel-based generators to meet that need.
Is The Duck Curve a Problem?
The Duck Curve presents both challenges and opportunities for power grid operators and utilities. Here are some key points to consider:
1. Grid Stability: As electricity demand fluctuates throughout the day, grid operators must balance the supply to maintain stability. The rapid ramp-up in demand during late afternoon hours poses a challenge in managing this balance as traditional fossil fuel-based generators may struggle to respond quickly enough.
2. Energy Storage: One potential solution to address the challenges posed by the Duck Curve is energy storage systems such as batteries. These systems can store excess solar-generated electricity during midday hours and discharge it during high-demand periods in late afternoon and evening, thus ensuring grid stability.
3. Demand Response: Another way to tackle the Duck Curve is to implement demand response programs that incentivize consumers to shift their usage patterns, helping to flatten the curve. For example, residential customers may be encouraged to run appliances during off-peak hours when solar generation is abundant.
4. Flexible Generation: Encouraging the adoption of alternative and more flexible forms of electricity generation, such as natural gas-fired power plants that can quickly ramp up or down, can help offset the variability caused by renewable energy sources such as solar and wind.
In conclusion, the Duck Curve is a consequence of the increasing integration of renewable energy sources into the electrical grid. While it presents some challenges in managing grid stability, there are several strategies and solutions—from energy storage to flexible generation—that can help mitigate these issues. As society continues to push for a greener future with less reliance on fossil fuels, addressing the Duck Curve will become increasingly important in ensuring a reliable and sustainable energy supply.


