How to view analytics Buffer Android
In the fast-paced world of social media, simply posting content isn’t enough. To truly connect with your audience, grow your brand, and achieve your marketing goals, you need to understand how your content is performing. That’s where analytics come in, offering a window into what resonates and what falls flat. For many social media managers and content creators on the go, Buffer has become an indispensable tool for scheduling posts across various platforms. But what about diving deep into your performance metrics when you’re away from your desktop? This article will guide you through the essential process of leveraging Buffer analytics on Android, ensuring you have critical data at your fingertips, no matter where you are.
While the desktop version of Buffer provides an exhaustive suite of analytical tools, the Android app offers a streamlined yet powerful experience designed for convenience. It’s a common misconception that mobile apps are always stripped-down versions, lacking the depth of their web counterparts. However, when it comes to Buffer analytics on Android, you’ll find a surprisingly robust set of features that can inform your strategy and help you make data-driven decisions in real-time. Let’s explore how to access, interpret, and act upon these insights.
1. Getting Started: Accessing Buffer Analytics on Android
Before you can glean any insights, you first need to know where to look. Accessing Buffer analytics on Android is straightforward, designed to be intuitive even for those who aren’t data scientists. Once you’ve opened the Buffer app on your Android device, you’ll typically land on your ‘Queue’ or ‘Posts’ screen, which shows your upcoming and recently published content. To navigate to the analytics section, look for the bottom navigation bar.
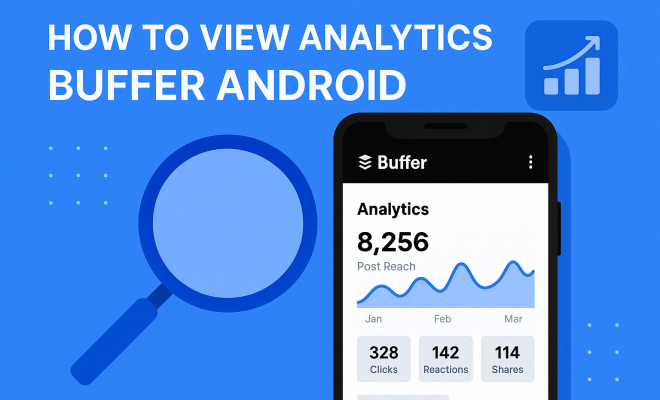
You’ll usually find an icon that represents ‘Analytics’ or ‘Performance.’ It might look like a bar chart or a graph. Tapping this icon will transport you to the core of your social media performance data. It’s important to ensure you’re logged into the correct Buffer account, especially if you manage multiple brands or profiles. The app will then display an overview of your chosen social media profile’s performance, allowing you to start drilling down into the specifics.
2. Profile Overview: Your Daily Snapshot
Upon entering the Buffer analytics section on Android, the first thing you’ll encounter is often a high-level overview of your selected social media profile. This ‘Profile Overview’ acts as your daily or weekly snapshot, providing quick insights into your recent performance. You’ll typically see key metrics like total reach, engagement rate, and perhaps follower growth over a specified period. This initial screen is invaluable for quickly assessing the general health of your social media presence without getting bogged down in individual post details.
Think of this as your dashboard. It should give you a sense of whether your overall strategy is moving in the right direction. Are your numbers up or down compared to last week? Is your engagement rate healthy? This immediate feedback allows you to react quickly. For instance, if you notice a sudden dip in reach, it might prompt you to investigate recent posts or changes in your content strategy, all from the convenience of your Android device.
3. Deep Dive: Individual Post Performance
While the profile overview is great for a general sense of things, the real power of Buffer analytics on Android often lies in its ability to show you individual post performance. From the main analytics screen, you can usually tap on a specific social media profile (e.g., your Instagram, Facebook, or X/Twitter account) to view a list of your recently published posts. Each post will typically display a summary of its key metrics directly underneath it or accessible with a tap.
This granular data is crucial. You can see which specific pieces of content are generating the most likes, comments, shares, and clicks. For example, on Instagram, you might see impressions, reach, and engagement for each photo or video. On X/Twitter, you’d look at impressions, engagements, and link clicks. This level of detail helps you identify content themes, formats, and posting times that resonate most effectively with your audience. Are your short-form videos outperforming static images? Are your questions generating more comments than your statements? The answers are all here.
4. Understanding Key Metrics: What Do They Mean?
To truly leverage Buffer analytics on Android, you need to understand what each metric represents. It’s not enough to just see numbers; you need to grasp their significance. Let’s break down some of the most common and important metrics you’ll encounter:
- Reach: This refers to the unique number of users who saw your post. It tells you how many individual eyeballs your content captured.
- Impressions: This is the total number of times your post was displayed, regardless of whether it was clicked or engaged with. A single user might see your post multiple times, contributing to higher impressions than reach.
- Engagement: This is a broad term encompassing various interactions like likes, comments, shares, saves, and sometimes clicks. A high engagement rate indicates your content is resonating and encouraging interaction.
- Clicks: Specifically, this refers to clicks on links, images, or profiles within your post. For content designed to drive traffic to your website or a specific landing page, link clicks are paramount.
- Follower Growth: This metric tracks how your audience size is changing over time. It’s a key indicator of whether your content is attracting new followers and expanding your community.
Each platform might present these slightly differently or include additional platform-specific metrics, but the core principles remain. By understanding these definitions, you can make more informed decisions about your content strategy, identifying what’s working and what needs adjustment. (See: Understanding analytics in digital marketing.)
5. Timeframes and Filters: Customizing Your View
One of the most useful features of Buffer analytics on Android is the ability to customize your data view. You’re not stuck with a default ‘last 7 days’ or ‘last 30 days’ perspective. Look for options to adjust the timeframe of your data. This is usually found at the top of the analytics screen, perhaps as a dropdown menu or a date range selector.
Being able to change the timeframe allows you to compare performance over different periods. Did your content perform better last month compared to this month? How did your holiday campaign fare against a regular week? This historical context is invaluable for identifying trends, seasonality, and the long-term impact of your content strategy. Some advanced Buffer plans, even on mobile, might also offer filters to sort posts by performance (e.g., ‘highest engagement’) or by content type, further refining your ability to pinpoint effective strategies.
6. Platform-Specific Insights: Tailoring Your Strategy
It’s crucial to remember that social media platforms are not monolithic. What works on Instagram might not work on X/Twitter, and vice versa. Buffer analytics on Android provides platform-specific insights, allowing you to tailor your strategy for each network. When you select a particular social media profile from your list, the metrics displayed will be relevant to that platform.
For example, when viewing Instagram analytics, you might see metrics related to profile visits or website clicks from your bio, which are unique to Instagram’s ecosystem. For X/Twitter, you’ll focus more on retweets and replies. This granular, platform-specific data empowers you to optimize your content for the nuances of each audience and algorithm. Don’t fall into the trap of a one-size-fits-all approach; use these insights to become a multi-platform maestro.
7. Actionable Insights: Turning Data into Strategy
Viewing Buffer analytics on Android is only half the battle; the real victory comes from turning that data into actionable insights. What good is knowing your engagement rate if you don’t use it to improve? Here’s how to translate your mobile analytics into a stronger social media strategy:
- Identify Top-Performing Content: Look for posts with exceptionally high reach, engagement, or clicks. What do they have in common? Was it the topic, the visual style, the call to action, or the time of day it was posted? Double down on these successful elements.
- Pinpoint Underperforming Content: Similarly, identify posts that flopped. Why didn’t they resonate? Was the topic irrelevant, the visual unappealing, or did you post at an off-peak time? Learn from these misses and avoid repeating them.
- Optimize Posting Times: By observing when your posts get the most engagement, you can refine your scheduling. Buffer’s scheduling feature, even on Android, allows you to adjust post times easily.
- Refine Content Types: If videos consistently outperform images, allocate more resources to video creation. If questions generate more comments than statements, incorporate more interactive prompts.
- Test and Iterate: Social media is constantly evolving. Use your analytics as a feedback loop. Try new content formats, hashtags, or calls to action, and then check your Buffer analytics on Android to see the results. It’s an ongoing process of experimentation and refinement.
By making this a regular practice, you’ll move beyond simply posting and start strategically building a more effective and engaging social media presence.
8. Limitations and Workarounds for Buffer Analytics on Android
While the Buffer Android app provides solid analytical tools for on-the-go management, it’s important to acknowledge that it doesn’t offer the full breadth of features available in the desktop version. For instance, detailed audience demographics, comprehensive report generation, or advanced team collaboration features for analytics might still require you to log into a web browser. The mobile experience is optimized for quick checks and immediate adjustments, not deep-dive strategic planning that involves exporting large datasets.
However, this doesn’t diminish its value. For most daily tasks, like checking recent post performance or seeing if a campaign is gaining traction, the Android app is more than sufficient. If you encounter a situation where you need more in-depth data, consider it a prompt to schedule dedicated time at your computer. A smart workflow might involve daily mobile checks and weekly or bi-weekly desktop deep dives for more comprehensive analysis and reporting. This hybrid approach ensures you get the best of both worlds: agility on the go and thoroughness when it matters most. (advantages of learning analytics)
9. The Future of Mobile Analytics: What to Expect
The landscape of mobile applications is continuously evolving, and social media management tools like Buffer are no exception. We’ve seen a clear trend towards enhancing mobile capabilities, bringing more powerful features from desktop platforms directly to our smartphones and tablets. It’s reasonable to expect that Buffer will continue to refine its Android app, potentially adding more sophisticated analytical tools over time. This could include more granular demographic data, more customizable reporting options, or even AI-powered insights that suggest improvements based on your performance history.
As smartphone screens get larger and mobile processing power increases, the distinction between desktop and mobile functionality will likely blur even further. For now, mastering the current iteration of Buffer analytics on Android gives you a significant advantage. It allows you to stay agile, responsive, and data-informed, ensuring your social media strategy remains effective even when you’re far from your office desk. The key is to integrate these mobile checks into your regular workflow, making data review a seamless part of your daily social media management routine.
10. Integrating Analytics with Your Content Calendar
Looking at numbers in isolation is helpful, but the real magic happens when you connect those numbers directly to your content. Your Buffer analytics on Android aren’t just for retrospective review; they should actively inform your upcoming content calendar. When you identify a top-performing post, for example, don’t just note its success. Open your Buffer queue right there on your Android device and brainstorm similar content ideas or themes to schedule for the coming days or weeks. This direct feedback loop means you’re not waiting until you’re back at a desktop to make strategic adjustments.
Imagine you see that your Tuesday morning “behind-the-scenes” story on Instagram got significantly higher reach and engagement than your typical product shot. You can immediately open the Buffer scheduler on your phone, duplicate that content type, and slot in another behind-the-scenes post for next Tuesday. This dynamic adjustment based on real-time mobile analytics makes your content strategy incredibly responsive and efficient. It’s about moving from “what happened?” to “what should I do next?” without missing a beat. (See: Youth Risk Behavior Surveillance System.)
11. Leveraging Competitive Benchmarking (Where Available)
While Buffer’s core analytics on Android focus on your own performance, understanding your standing relative to competitors can offer valuable context. Some advanced Buffer plans or integrated third-party tools (which might be accessible via a mobile browser even if not native to the app) offer competitive benchmarking features. While a full competitive analysis is generally a desktop-heavy task, a quick check on your phone can still provide directional insights.
For example, if you’re consistently seeing high engagement rates for your industry on your profile overview, that’s a good sign. If your follower growth is stagnant compared to industry averages you might have access to, it could signal a need for more aggressive outreach or different content types. Even without direct competitor data in the Buffer Android app, you can use your mobile insights to compare against general industry benchmarks you might have memorized or noted down. This helps you gauge if your “good performance” is truly excellent, or if there’s still significant room for improvement relative to the broader market.
12. The Psychology Behind Engagement Metrics
Understanding the raw numbers is one thing, but understanding the human behavior behind those numbers is another. When you look at Buffer analytics on Android and see high engagement on a particular post, ask yourself *why* people engaged. Was it an emotional appeal? Did it solve a problem? Did it spark curiosity? For instance:
- Likes/Reactions: Often signals agreement, appreciation, or simple acknowledgement. It’s a low-effort way for users to say, “I saw this, and I generally approve.”
- Comments: Indicates a deeper level of engagement. Users are taking the time to articulate a thought, ask a question, or share an opinion. This suggests the content truly resonated or provoked thought.
- Shares/Retweets: The highest form of endorsement. Users are essentially saying, “This content is so good/important that I want my own network to see it.” It significantly boosts reach and credibility.
- Saves (Instagram/Pinterest): Users find the content valuable enough to revisit later. This often points to evergreen, practical, or inspirational content.
- Link Clicks: Directly shows intent. Users are interested enough to leave the platform and explore more. This is crucial for driving traffic and conversions.
By thinking about the psychology, you can reverse-engineer what makes content sticky and replicate those psychological triggers in future posts, refining your strategy beyond just surface-level data points.
13. Best Practices for Daily Mobile Analytics Checks
To truly get the most out of Buffer analytics on Android, integrate it into your daily routine. Here are some quick best practices:
- Set a Specific Time: Dedicate 5-10 minutes each morning or evening to review your performance. Consistency is key.
- Focus on Key Profiles: If you manage many accounts, pick 1-2 priority profiles for your daily check and save deeper dives for weekly desktop sessions.
- Look for Anomalies: Don’t just scan. Look for posts that significantly over or under-performed. These are your learning opportunities.
- Connect to Recent Activity: Relate the data back to what you posted recently. Did that new hashtag campaign work? Did the reel you spent extra time on pay off?
- Make One Small Adjustment: Don’t try to overhaul your entire strategy on your phone. Instead, identify one small, actionable change you can make immediately, like rescheduling a post or drafting a similar top-performing piece.
These small, consistent actions compound over time, making your social media efforts much more effective.
14. Expert Perspective: What Industry Leaders Say About Mobile Analytics
Social media experts consistently emphasize the importance of data-driven decisions, and increasingly, they’re highlighting the role of mobile tools. Sarah Evans, a digital strategist, often speaks about the need for “agile marketing,” where marketers can react quickly to trends and performance shifts. “If you can’t check your analytics on the go,” she argues, “you’re losing valuable time. Mobile apps like Buffer’s give you that real-time pulse check, allowing you to pivot without being tethered to a desk.”
Another perspective comes from analytics guru Avinash Kaushik, who stresses the importance of “actionable insights” over “data puke.” While he often focuses on deeper web analytics, the principle applies perfectly to mobile. The Buffer Android app distills complex data into digestible, actionable metrics specifically so you *can* make quick decisions. It’s not about seeing every possible number, but seeing the *right* numbers at the right time to inform your next move.
15. Frequently Asked Questions About Buffer Analytics on Android
Q1: Is Buffer analytics on Android available for all Buffer plans?
A: Most core analytics features, like individual post performance and profile overviews, are available across all Buffer plans, including the free tier. However, more advanced features like deeper historical data, specific audience demographics, or detailed report exports might be exclusive to paid plans or require the desktop version.
Q2: Can I compare performance across different social media platforms within the Android app?
A: Yes, you can switch between your connected social media profiles (e.g., Instagram, Facebook, X/Twitter) to view their individual analytics. While you won’t see a direct side-by-side comparison chart for all platforms simultaneously on the same screen, you can easily toggle between them to get a sense of comparative performance. (See: The role of analytics in social media.)
Q3: Does the Buffer Android app show real-time analytics?
A: Buffer typically updates its analytics data every few hours or daily, depending on the platform and specific metric. While it’s not strictly “real-time” in the sense of second-by-second updates, it’s certainly close enough for daily strategic adjustments and understanding recent post performance.
Q4: Can I export analytics reports from the Android app?
A: Generally, the Buffer Android app doesn’t support exporting detailed analytics reports (e.g., to CSV or PDF files). This functionality is usually reserved for the desktop version of Buffer, where you have more screen real estate and processing power for generating comprehensive reports.
Q5: Are audience demographics available on Buffer analytics for Android?
A: Basic audience insights, like follower growth, are usually available. However, detailed audience demographics (like age, gender, location of your followers) are typically more comprehensive and accessible through the desktop Buffer dashboard or directly within each social media platform’s native analytics tools. See also social media tips for educators.
Q6: How accurate are Buffer’s mobile analytics?
A: Buffer pulls its data directly from the APIs of the respective social media platforms (Facebook, Instagram, X/Twitter, etc.). This means the data presented in the Buffer Android app is as accurate as the data provided by the social networks themselves. There shouldn’t be any significant discrepancies compared to what you’d see on the desktop version or directly on the platform.
Q7: Can I use Buffer analytics on Android to track ad performance?
A: Buffer’s analytics primarily focus on organic post performance. While scheduled posts that are part of an ad campaign might show up, Buffer doesn’t offer in-depth analytics for paid social media campaigns. For detailed ad performance metrics, you’ll need to use the ad managers provided by each social media platform (e.g., Facebook Ads Manager).
Q8: What if I have trouble finding the analytics section in the Buffer Android app?
A: First, ensure your Buffer app is updated to the latest version. The analytics icon is usually at the bottom navigation bar and often looks like a bar chart or graph. If you still can’t find it, try restarting the app or checking Buffer’s official help documentation for screenshots and specific navigation instructions, as app interfaces can sometimes change slightly with updates.
Ultimately, your Android device can be a powerful ally in understanding and improving your social media performance. Don’t underestimate the insights available through Buffer’s mobile app. By regularly checking your analytics, you’ll gain a clearer picture of what truly resonates with your audience, empowering you to create content that not only gets seen but also drives meaningful engagement and results.
Trending Now
Frequently Asked Questions
How do I access Buffer analytics on Android?
To access Buffer analytics on Android, open the Buffer app and navigate to the bottom navigation bar. Look for the 'Analytics' or 'Performance' icon, usually represented by a bar chart or graph. Tapping this icon will take you to your analytics dashboard.
What features does Buffer analytics offer on mobile?
Buffer analytics on mobile provides a streamlined experience with essential features such as performance metrics for your posts, engagement statistics, and audience insights. These tools help you understand your content's effectiveness and make data-driven decisions on the go.
Can I view my social media performance on Buffer's Android app?
Yes, you can view your social media performance on Buffer's Android app. The app includes an analytics section where you can track engagement, reach, and other key metrics for your posts, allowing you to monitor your performance from anywhere.
Is Buffer's mobile app as effective as the desktop version for analytics?
Yes, Buffer's mobile app is effective for analytics, offering a robust set of features similar to the desktop version. While it may be streamlined for convenience, it still provides valuable insights to help you manage your social media strategy effectively.
How can I interpret Buffer analytics data on my Android device?
Interpreting Buffer analytics data on your Android device involves reviewing metrics such as likes, shares, comments, and reach. Use these insights to identify what content resonates with your audience, helping you refine your social media strategy.
What's your take on this? Share your thoughts in the comments below — we read every one.