How to Run Regression In Excel
Regression analysis is a statistical technique used to determine the relationship between two or more variables. In business, it is commonly used to examine the effects of a particular variable or set of variables on a target outcome. Excel is a popular tool for performing regression analysis, as it offers a variety of functions and tools that make the process easier than ever before.
Here are the basic steps to follow when running a regression analysis in Excel:
Step 1: Gather your data
The first step is to collect the data you will need for your regression analysis. This may include both dependent and independent variables, as well as any other relevant data that will help you identify patterns and trends. Once you have collected your data, you can begin organizing it in a spreadsheet.
Step 2: Open the “Data Analysis” Tool
To run a regression analysis in Excel, you will need to enable the “Data Analysis” Tool in Excel. To do this, click on the “File” tab, then select “Options” and click “Add-ins.” From there, select “Excel Add-ins” in the “Manage” dropdown menu, then click “Go.” Check the box next to “Analysis Toolpak” and click “OK.”
Step 3: Select your Data Range
Now that you have enabled the “Data Analysis” Tool, you can begin selecting the data you want to use for the regression analysis. Highlight all of the information you want to analyze, including both the independent and dependent variables.
Step 4: Set up the Regression Tool
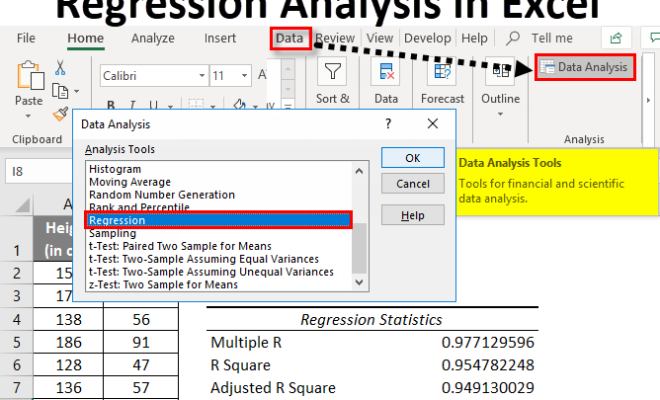
Click on the “Data” tab in the Excel ribbon, and select the “Data Analysis” button. From there, choose “Regression” from the list of analysis tools.
Step 5: Input the Data Range and Variables
Click the “Input Y Range” button and select the dependent variable you want to analyze in the “Column” dialogue box. Next, click the “Input X Range” button and select the independent variables you want to include in the analysis. Make sure to select all of the variables you want to include in the regression by holding down the ‘ctrl’ key while selecting.
Step 6: Output the Regression Results
Check the box next to “Labels” in the “Output options” field to create a label for the regression results. Next, select “New Worksheet Ply” from the “Output range” field to generate a new sheet to show the results of the regression analysis. Finally, click “OK.” The regression output will appear in a new worksheet with information of data such as the R^2, coefficient values and more.
Following these steps will help you conduct a regression analysis in Excel quickly and accurately. Remember to double-check your data and ensure that all variables are correctly labeled and organized to produce the most accurate results possible. With practice, you should become more comfortable running regression analyses in Excel quickly and efficiently.