How to Create a Control Chart: 10 Steps

A control chart is a powerful tool for monitoring and controlling processes in various industries. Besides helping organizations to improve their overall process efficiency, control charts aid in identifying potential problems before they become full-blown issues. Here are ten steps to create an effective control chart.
1.Define the objective: Define the purpose of the control chart and what performance indicator you want to measure. This could be product quality, process efficiency, or even customer satisfaction.
2.Choose the right type of control chart: Several types of control charts exist, including X-bar and R charts for variable data and p- and c-charts for attribute data. Select the one that best fits your data type and specific needs of your process.
3.Determine sample size and frequency: Decide on the appropriate sample size (the number of observations in each subgroup) and frequency (how often you’ll collect data). This largely depends on factors like the cost of collecting samples, time constraints, or variability in the process.
4.Collect the data: Measure the targeted process over a period of time, making sure to gather data points in a consistent manner. Pay attention to any factors that could influence outcomes – such as special events or changes in personnel.
5.Calculate necessary statistics: Depending on your chosen control chart type, calculate statistics like subgroup averages, ranges, standard deviations, or proportions of defective items.
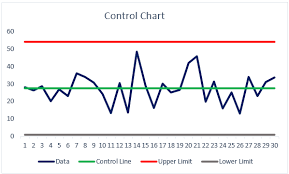
6.Establish control limits: These limits will help you identify outliers that signal when your process is out of control. To do this, calculate the average line (centerline) as well as upper and lower control limits (UCL, LCL) typically set at plus or minus three standard deviations from the centerline.
7.Plot the data on a chart: Using your chosen software or graph paper, plot your measured values against time along with average or centerline values and the control limits.
8.Interpret the control chart: Look for data points outside control limits and analyze patterns or trends. Out-of-control points can signal process instability affecting product quality or signaling other issues that need attention.
9.Implement process improvements: After detecting and analyzing outliers, take actions to correct root causes and improve overall process performance. This could involve training employees, making equipment adjustments, or revising protocols.
10.Monitor and update the control chart: Continuously monitor the chart, adjusting control limits as needed, especially since changes may occur in the process that will affect control limits’ validity. Using updated charts makes sure you continue to identify out-of-control points accurately.
By following these ten simple steps, you can create a robust control chart to help you proactively manage processes within your organization and ensure consistent performance over time.


