How to calculate z test statistic

Introduction
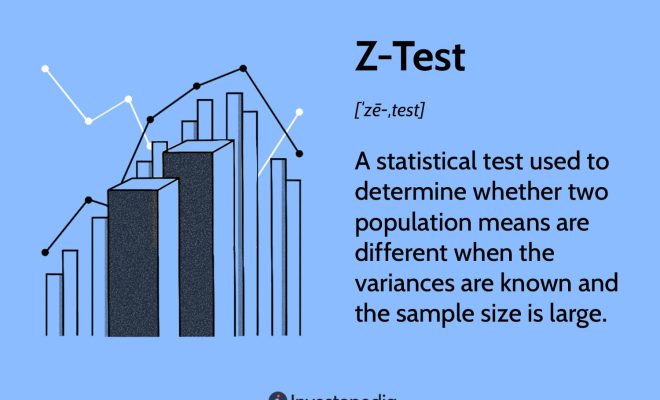
The z-test is a statistical method used to determine whether there is a significant difference between the observed and expected values of a specific variable. It is useful when dealing with large sample sizes and allows researchers to test hypotheses regarding the population mean or proportion. This article will guide you through the process of calculating the z-test statistic for simple conditions.
Step 1: Identify Hypotheses
To perform a z-test, start by identifying your null and alternative hypotheses. The null hypothesis (H0) typically assumes no significant difference between observed and expected values, while the alternative hypothesis (H1) is the opposite.
For example, suppose you want to test if the average height of men in a city is higher than 175 cm. Your null hypothesis would be that there is no significant difference between the actual average height and 175 cm, while the alternative hypothesis states there is a difference.
Step 2: Gather Data
Next, gather data from random samples of your targeted population. You will need to calculate or obtain sample size (n), sample mean (x-bar), and standard deviation (σ).
Continuing with our height example, let’s assume you surveyed 100 men, and found that their average height was 180 cm, with a standard deviation of 10 cm.
Step 3: Define Alpha Level and Z-Critical Values
Before calculating the z-test statistic, determine your chosen alpha level (α) — usually set at 0.05 or 0.01 — which corresponds to a significance level in hypothesis testing. Then find corresponding Z-critical values using standard normal distribution tables or online tools.
For example, if you choose an alpha level of 0.05 and are conducting a two-tailed test, your z-critical value would be ±1.96.
Step 4: Calculate Standard Error
Standard error (SE) reflects the variability of your sample mean. Calculate it using this formula:
SE = σ / √n
For our example:
SE = 10 cm / √100 = 1 cm
Step 5: Calculate Z-Test Statistic
Finally, it’s time to calculate the z-test statistic using the following formula:
Z = (x-bar – μ0) / SE
Where:
– x-bar is the sample mean
– μ0 is the expected value (null hypothesis value)
– SE is the standard error calculated earlier
Applying this formula to our example:
Z = (180 cm – 175 cm) / 1 cm = 5
Step 6: Interpret Results and Draw Conclusions
Compare your z-test statistic (calculated in step 5) with the z-critical value (determined in step 3). If your z-test statistic falls within the z-critical values, you cannot reject the null hypothesis. However, if it falls outside those values, you can reject the null hypothesis.
In our example, the z-test statistic (5) is greater than our z-critical value (±1.96), so we have enough evidence to reject our null hypothesis and accept that men’s average height in this city is significantly different from 175 cm.
Conclusion
Calculating a z-test statistic involves identifying hypotheses, gathering data, selecting an alpha level, finding a critical value, calculating standard error, and ultimately comparing your statistics to draw conclusions. By following these steps, you’ll be capable of conducting a thorough statistical analysis using z-tests in various research situations.


