
How to calculate the t statistic
Introduction:
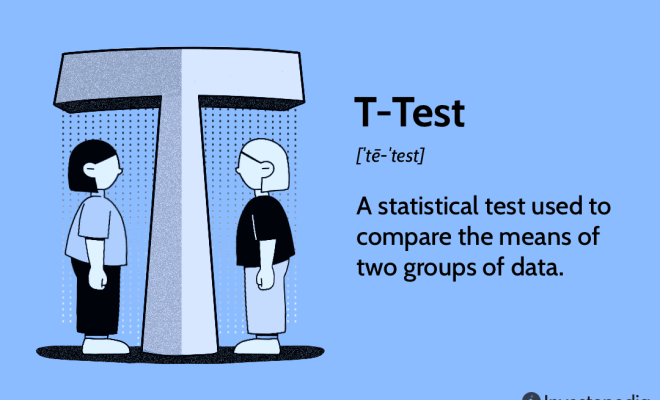
In the world of statistics, the t-statistic is a crucial tool used to compare two sample means and determine if there is a significant difference between them. This test is particularly useful when dealing with small samples or when the population standard deviation is unknown. In this article, we will discuss steps to calculate the t-statistic for comparing two independent samples.
Step 1: Understand Your Data and Hypotheses
Before calculating the t-statistic, you need to ensure you have two independent samples from two different groups or populations. Also, formulate your null hypothesis (H0) stating that there is no significant difference between the population means and your alternative hypothesis (H1) indicating that a significant difference exists.
Step 2: Calculate Sample Means and Standard Deviations
For both samples, calculate their mean (average) values:
Mean (M) = Sum of observations / Number of observations
Calculate the standard deviation for each sample:
Standard deviation (SD) = √(Sum of squared differences from the mean / (Number of observations -1))
Step 3: Calculate Standard Error of the Difference Between Means
To express the degree of uncertainty surrounding the difference in means, we need to determine the standard error of this difference. You can achieve this using the following formula:
Standard error (SE) = √[(SD1² / n1) + (SD2² / n2)]
Here, SD1 and SD2 represent standard deviations of both samples, n1 and n2 are their respective sample sizes.
Step 4: Compute T-Statistic
Once you have determined all necessary values, calculate the t-statistic using this formula:
T = (M1 – M2) / SE
Where M1 and M2 are means for both groups.
Step 5: Determine Degrees of Freedom
The degrees of freedom (df) for the t-test is calculated as:
df = n1 + n2 – 2
Step 6: Comparison with T-Distribution
Now, determine the critical value (t*) from the t-distribution table using the df and selected significance level (commonly alpha = 0.05). Make a decision based on this comparison:
– If the calculated t-statistic is greater than the critical value (t > t*), you reject the null hypothesis. This conclusion implies that a significant difference exists between both population means.
– If the calculated t-statistic is less than or equal to the critical value (t ≤ t*), you fail to reject the null hypothesis, meaning there’s no significant evidence indicating a difference between the population means.
Conclusion:
Calculating the t-statistic is crucial when analyzing small samples or when information about population variances is absent. Following these steps will help you conduct a t-test with confidence, ensuring sound statistical decisions and findings.


