How to calculate quartiles in excel
Quartiles are significant statistical parameters that divide a dataset into four equal parts. They help in understanding the distribution, central tendency, and dispersion of data. In this article, we will walk you through the process of calculating quartiles in Microsoft Excel.
Step 1: Organize Your Data
Before you begin, arrange your data in ascending order. To do this, click on any cell within your dataset, go to the ‘Data’ tab on the Excel ribbon, click ‘Sort Smallest to Largest’ or select ‘Sort’ from the right-click context menu. Once sorted, you are ready to calculate quartiles.
Step 2: First Quartile (Q1)
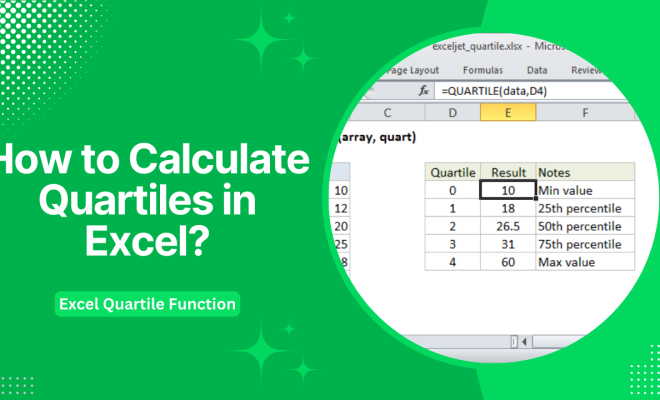
To find the first quartile (Q1), which separates the lowest 25% of the data from the rest, use the QUARTILE.INC or QUARTILE.EXC function. Here’s how:
1. Select an empty cell where you want the result to appear.
2. Type =QUARTILE.INC(data_range,1) and press Enter. Replace “data_range” with your actual data range.
(Example: =QUARTILE.INC(A1:A20, 1))
3. For exclusive quartile calculation use =QUARTILE.EXC(data_range, 1).
Step 3: Second Quartile (Q2) or Median
The second quartile (Q2) is also known as the median and divides the data set into two halves. To calculate Q2:
1. Select an empty cell.
2. Type =QUARTILE.INC(data_range,2) and press Enter.
(Example: =QUARTILE.INC(A1:A20, 2))
3. For exclusive quartile calculation use =QUARTILE.EXC(data_range, 2).
Step 4: Third Quartile (Q3)
The third quartile (Q3) separates the highest 25% of the dataset from the rest. To find Q3:
1. Select an empty cell.
2. Type =QUARTILE.INC(data_range,3) and press Enter.
(Example: =QUARTILE.INC(A1:A20, 3))
3. For exclusive quartile calculation use =QUARTILE.EXC(data_range, 3).
Step 5: Interquartile Range (IQR)
The Interquartile Range (IQR) helps in understanding the spread of the data and is calculated using the formula IQR = Q3 – Q1. To find IQR:
1. Select an empty cell.
2. Use this formula: =Cell_with_Q3_value – Cell_with_Q1_value
(Example: =C2-C1)
Conclusion
Calculating quartiles in Excel is now just a few clicks away! With this step-by-step guide, you can quickly analyze your data’s distribution and central tendency to make informed decisions or gain valuable insights. So go ahead and apply these simple techniques to make your data tell you a meaningful story.