How to calculate mse in excel

Introduction
Mean Squared Error (MSE) is a commonly used metric in data analysis and machine learning for evaluating the accuracy of an estimation or prediction. It measures the average squared difference between the predicted and actual values, and a lower MSE signifies a more accurate model. In this article, we will learn how to calculate the Mean Squared Error in Excel using simple steps.
Step 1: Organize your data
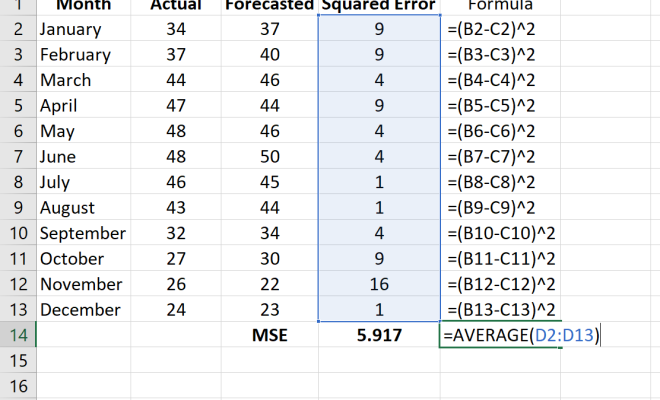
To begin with, organize your data in two separate columns – one for the actual values (Y) and another for predicted values (Y_hat). Ensure that both columns have an equal number of data points.
Step 2: Calculate the residuals
The residual is the difference between the actual value and the predicted value. In Excel, you can use a simple formula to do this. Insert a new column called ‘Residuals’ to store these differences.
In C2, enter the following formula and then drag it down to cover all your data points:
=A2-B2
Now you have the residuals for each data point in column C.
Step 3: Square the residuals
Insert a new column called ‘Squared_Residuals’ to store squared residuals. The squared residuals help account for both underestimates and overestimates by penalizing large errors more severely than smaller errors.
Use this formula in D2, and drag it down through all your dataset:
=C2^2
Step 4: Calculate the Mean Squared Error
Now that we have our squared residuals organized in column D, we can calculate our Mean Squared Error. In an empty cell, type this formula:
=AVERAGE(D2:Dx)
Replace “x” with the last row number that contains your data points.
The result will be your Mean Squared Error for your dataset.
Conclusion
Calculating Mean Squared Error in Excel is a straightforward and valuable practice for assessing the performance of your predictions or estimations. By following these simple steps, you can easily incorporate MSE into your analytical toolbox and improve your models’ accuracy with this essential metric.


