How to calculate heart rate variability

Every beat of your heart has a purpose and, as it turns out, the time between each beat holds valuable information. This variability in time is known as Heart Rate Variability (HRV), and it’s a useful measure of how well our body adapts to stress and environmental demands. In this article, we’ll delve into how to calculate your HRV, its potential benefits, and why it’s important for maintaining optimal health.
What is Heart Rate Variability?
Heart Rate Variability is the fluctuation in time intervals between successive heartbeats. This variability occurs within the context of both one’s resting state and periods of activity, with increased HRV generally signifying better cardiovascular health.
Why is HRV Important?
HRV provides insight into the balance of our autonomic nervous system (ANS), which controls vital bodily functions such as digestion, breathing, and heart rate. The ANS has two primary components: the sympathetic nervous system (SNS) – responsible for the ‘fight-or-flight’ response; and the parasympathetic nervous system (PNS) – which promotes relaxation and recovery through its ‘rest-and-digest’ mechanisms.
A higher HRV implies a balanced ANS, as it reflects an individual’s ability to manage stress effectively by adopting appropriate physiological responses. Conversely, low HRV may indicate chronic stress or unhealthy lifestyle choices.
How to Calculate Heart Rate Variability
To calculate your HRV, you’ll need data from an electrocardiogram (ECG) or a reliable heart rate monitor. The following steps will guide you through this process:
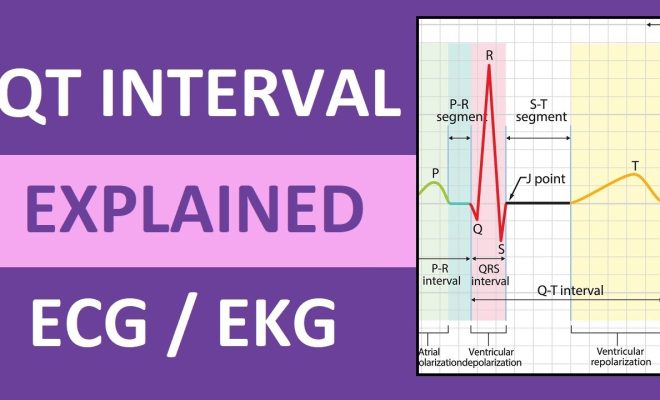
1. Collect R-R Intervals: R-R intervals are the time gaps between successive R-peaks in a heartbeat. Collect several minutes’ worth of continuous R-R intervals during periods of rest or activity using your ECG or heart rate monitor.
2. Time Domain Methods: Time domain methods involve making simple statistical calculations using various HRV measures. These may include:
– SDNN (Standard Deviation of Normal-to-Normal intervals): This represents the overall HRV, indicating a healthy response to stress and effective recovery.
– RMSSD (Root Mean Square of Successive Differences): This measure reflects short-term changes in HRV and is generally seen as a marker of parasympathetic activity.
3. Frequency Domain Methods: Frequency domain methods analyze HRV measures according to their corresponding frequencies. The most common method involves spectral analysis using Fourier Transform techniques. Key frequency bands include:
– Very Low Frequency (VLF): Represents various hormonal factors and temperature regulation
– Low Frequency (LF): Reflects both sympathetic and parasympathetic activity
– High Frequency (HF): Correlates with respiration and primarily associated with parasympathetic activity
4. Non-linear Methods: These methods evaluate the more complex, non-linear aspects of HRV. Common approaches include Poincaré plots, detrended fluctuation analysis, and approximate entropy metrics.
By combining time domain, frequency domain, and non-linear methods, you can establish a comprehensive understanding of your heart rate variability.
Bottom Line
Calculating your HRV is an essential step towards better health as it can reveal critical information about your body’s ability to respond effectively to stressors and recover from them. With the right tools in place, such as an ECG or heart rate monitor, it becomes an effective way to monitor and optimize your overall wellbeing.


