How to calculate central tendency

Introduction:
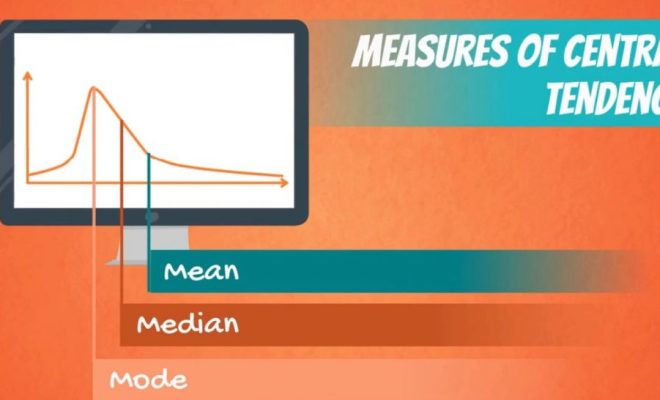
Central tendency is a key concept in the field of statistics that helps us understand the center or typical value of a set of data. There are three common measures used to calculate central tendency: mean, median, and mode. In this article, we will outline the steps to calculate each of these measures, as well as discuss their relevance and limitations.
1.Mean
The mean, also known as the average, is calculated by adding up all values in a dataset and then dividing the sum by the total number of values. The mean is a widely used measure of central tendency because it accounts for all data points in a dataset. To calculate the mean, follow these steps:
Step 1: Add all values in the dataset.
Step 2: Count the total number of data points.
Step 3: Divide the sum by the total number of values.
Mean = (Sum of Values) / (Total Number of Values)
Keep in mind that while calculating the mean can provide valuable insights into a dataset’s center, it is sensitive to extreme values or outliers. Thus, it may not accurately represent the typical value in certain cases.
2.Median
The median represents the middle value within a dataset when sorted in either ascending or descending order. If there is an even number of data points in a dataset, the median corresponds to the average of the two middle values. Calculating the median involves these steps:
Step 1: Sort data points in ascending or descending order.
Step 2: Identify the middle value(s).
– If there is an odd number of values, select the middle one as your median.
– If there is an even number of values, take the average of the two middle ones.
Unlike the mean, which can be skewed by extreme values or outliers, the median tends to offer a more accurate representation of central tendency for datasets with outliers.
3.Mode
The mode is the most frequently occurring value within a dataset. It can be useful in understanding the tendency of categorical variables or variables that follow a non-normal distribution. To calculate the mode, follow these steps:
Step 1: Count the occurrences of each value.
Step 2: Identify the value with the highest frequency.
It is vital to note that there can be more than one mode if two or more values occurred with equal frequency. In such cases, the dataset is called multimodal.
Conclusion:
Understanding how to calculate central tendency is crucial for analyzing and interpreting data in various fields. Mean, median, and mode are three essential measures, each with advantages and limitations based on the dataset’s characteristics. Selecting the appropriate measure for assessing central tendency ultimately depends on the nature of your data and your analysis goals.


