How is hrv calculated

Introduction
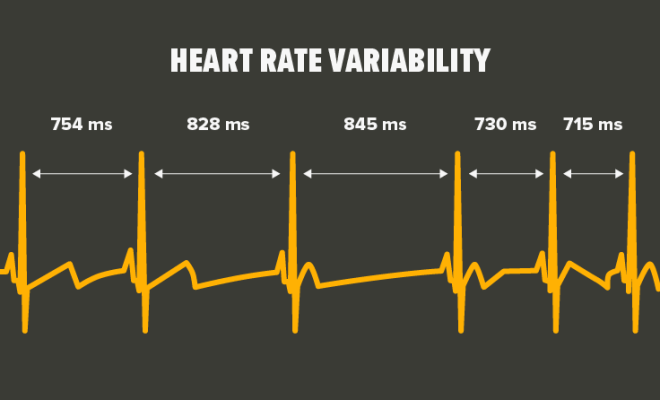
Heart Rate Variability (HRV) refers to the changes in time intervals between consecutive heartbeats, known as RR intervals. It is a crucial non-invasive metric in assessing the autonomic nervous system (ANS) functioning and the balance of the sympathetic and parasympathetic branches. This article will delve into the process of HRV calculation using various methods and techniques.
Time-Domain Methods
These methods involve the analysis of RR intervals over a given duration. Some popular time-domain metrics are:
1. SDNN (Standard Deviation of NN intervals): It reflects the overall HRV by calculating the standard deviation of all recorded RR intervals during a specific period.
2. RMSSD (Root Mean Square of Successive Differences): It measures short-term variations in HRV by calculating the root mean square of successive differences between NN intervals.
3. NN50 and pNN50: NN50 denotes the count of the adjacent pairs of intervals differing by at least 50 ms. pNN50 represents the percentage of NN50 to total NN intervals.
Frequency-Domain Methods
These methods transform RR interval data into frequency components, highlighting periodicities that correspond to various physiological processes:
1. Low Frequency (LF) power: Ranging from 0.04 to 0.15 Hz, it represents a mix of sympathetic and parasympathetic activities.
2. High Frequency (HF) power: Ranging between 0.15 and 0.4 Hz, it corresponds mainly to parasympathetic activity, specifically respiratory sinus arrhythmia.
3. LF/HF ratio: This ratio is used to estimate the balance between sympathetic and parasympathetic contributions to HRV.
Nonlinear Methods
These methods focus on capturing complex dynamics within heart rate signals that may not be evident via linear methods:
1. Poincaré Plot: A scatterplot where the current RR interval is plotted against the next RR interval. SD1 and SD2 are calculated to estimate short-term and long-term HRV variations.
2. Approximate Entropy (ApEn) and Sample Entropy (SampEn): These measures of complexity estimate the predictability within a time series of RR intervals.
3. Detrended Fluctuation Analysis (DFA): It quantifies the presence of fractal-like correlation properties in the HRV signal.
Overall, HRV can be calculated using various techniques, each offering unique insights into the functionality of the autonomic nervous system. In clinical and research settings, a combination of these methods helps provide a comprehensive understanding of ANS function and its relation to health and performance outcomes.


